
Using Network Statistics to Time Hardware Decisions
Hardware decisions are made against a moving target. At difficulty 132.76 T, each TH/s of hashrate earns about $0.038 a day gross, so a 20 J/TH machine paying $0.06/kWh spends $0.0288 of that on power and keeps $0.0092 — a margin small enough that the timing of a deployment matters almost as much as the efficiency of the machine. The statistics that decide that timing are difficulty, network hashrate, and the break-even efficiency your power price implies.

Key takeaways
- At $0.06/kWh, a machine needs to beat 26.4 J/TH to stay above its power cost; at $0.04/kWh the ceiling rises to about 39.6 J/TH.
- The next difficulty adjustment was estimated at -2.12%, worth roughly $0.41 a day to a 500 TH/s rig — about $12.30 over a month.
- Delaying a 500 TH/s deployment by 30 days costs about $138 in net margin, an order of magnitude more than the dip is worth.
- At 5 PH/s, 0.05 BTC takes about 22.3 days; at 500 TH/s the same target takes 222.9 days — use the target to size the order, not the other way round.
The core idea
Three statistics translate directly into a hardware decision. Difficulty sets output per TH/s. Network hashrate tells you how much of tomorrow's difficulty is already on order, because it is the aggregate of everyone else's buying decisions. Your power price sets the efficiency floor below which a machine cannot be run profitably at today's difficulty, whatever it cost to buy.
Combine them and the question stops being "should I buy hardware now?" and becomes "at what efficiency and price does this deployment clear its own power cost?" That is answerable today, with numbers, before anything is ordered.
The break-even efficiency
Divide output per TH/s by your power price to get the energy budget per TH/s per day. At $0.038 of income per TH/s and $0.06/kWh, the budget is 0.6333 kWh per TH/s per day — 26.4 W, meaning a 26.4 J/TH machine. Above that figure, the machine's power bill exceeds its gross output at current difficulty; the fee makes the real line slightly less forgiving.
What the next retarget is worth
A difficulty change of -2.12% raises output per TH/s by about 2.17%, because the relationship is multiplicative: dividing by 0.9788 rather than subtracting 2.12%. That is a real but modest repricing, and it is dwarfed by the cost of leaving hardware idle while waiting for it.
| Decision | Statistic to watch | Reference value |
|---|---|---|
| Deploy now or wait | Output per TH/s at current difficulty | $0.038 per TH/s per day gross at 132.76 T |
| Keep running an older model | Break-even efficiency versus your power price | 26.4 J/TH at $0.06/kWh; 39.6 J/TH at $0.04/kWh |
| Time the order | Next difficulty adjustment | Estimated -2.12%, worth about $0.41 a day per 500 TH/s |
| Choose which chain | Per-chain network hashrate and emission | Convert to per-TH/s output before comparing |
| Size a hashrate order | Days to a target balance | 0.05 BTC in 22.3 days at 5 PH/s, 222.9 days at 500 TH/s |
How it plays out at scale
At scale, timing mistakes compound. A 5 PH/s order of 20 J/TH machines draws 100 kW and consumes 2,400 kWh a day, $144 at $0.06/kWh, against 0.0022430 BTC — $189.97 — of daily gross output. Net margin is $45.97 a day, or about $1,379 a month. Every week of delay in that deployment costs roughly $322 of net margin, which is why waiting for a perfect entry point is usually the more expensive strategy.
Efficiency decisions behave differently. Replacing a 30 J/TH machine with a 20 J/TH machine at the same site does not change hashrate; it changes the power bill. At $0.06/kWh the difference is about 2.4 W per TH/s, which on 500 TH/s is 1.2 kW — 28.8 kWh a day, about $1.73 daily, $52 a month per 500 TH/s of capacity. That saving is independent of difficulty, which makes efficiency upgrades the more durable of the two levers.
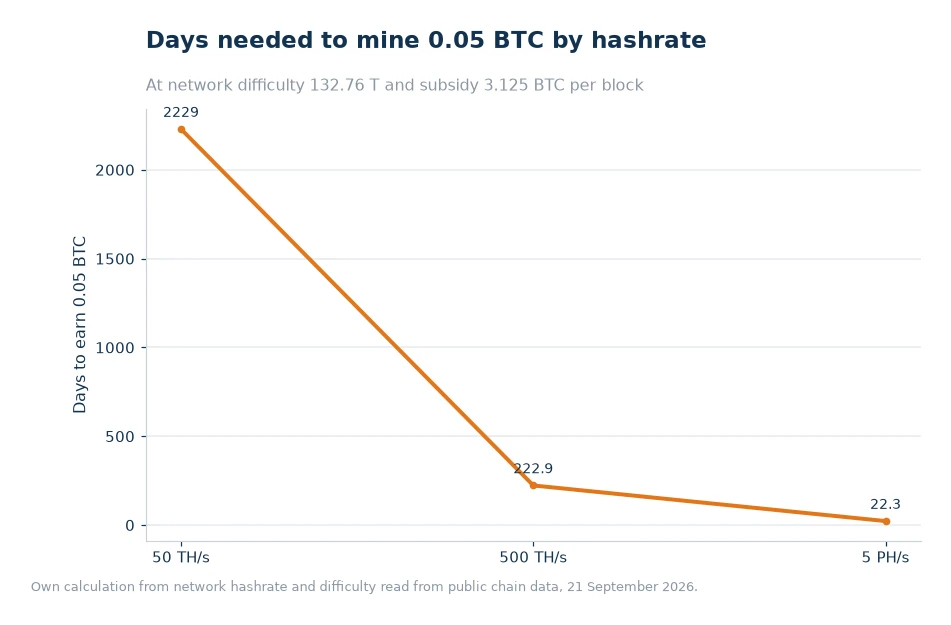
Two scenarios compared
Scenario 1: wait for the dip. An operator holds back a 500 TH/s deployment for a month to capture the estimated -2.12% adjustment. At $19.00 a day of gross output, the 2.17% uplift is worth $0.41 a day, or about $12.30 across the month.
Scenario 2: deploy now. The same 500 TH/s runs for the full 30 days. Gross output is 30 × $19.00 = $570; power is 10 kW for 720 hours, which is 7,200 kWh, or $432 at $0.06/kWh. Net margin is $138 for the month — against $12.30 of missed uplift in the first scenario. Waiting costs about nine times what it saves, and that is before considering that network hashrate may already have absorbed the retarget by the time the machines arrive.
The comparison changes if power is unusually cheap or the hardware is unusually inefficient, so run it with your own numbers rather than inheriting one. A pool hashrate view supplies the network side of the ratio, and the profitability tables published for current conditions make the efficiency comparison concrete: the miner ranking shows which models still clear their power cost at today's price and difficulty.
Common failure modes
- Comparing nominal hashrate across generations without accounting for J/TH, which is the variable that decides the power bill.
- Using a stale difficulty in a payback estimate — retargets land every 2,016 blocks and the estimate ages with them.
- Treating a difficulty dip as a buying signal when the same dip often coincides with hashrate already committed and hardware still in transit.
- Ignoring the reliability of the target chain. Chain-level statistics are only as good as the pool's uptime on that chain, since downtime removes output that no calculation restores.
- Forgetting settlement timing in cash-flow planning: hourly credits under PPS+, or distributions after six confirmations over the last five difficulty rounds under PPLNS, which is the difference between self-funding a month and financing it.
One discipline ties the whole exercise together: keep the numbers in a single place and re-derive them after every retarget. The ViaBTC Mining Statistics page publishes pool hashrate, network hashrate, difficulty and miner counts per coin, which is the full input set for the arithmetic above — and the same figures a buyer should recheck on the day the machines are unloaded, not the day the order was placed.
Frequently asked questions
Is a bigger pool always better?
Size reduces payout variance but also concentrates hashrate. What matters more is fee structure, uptime, latency and payout cadence.
What happens if my miner goes offline?
Shares stop, so expected income stops with them. Alerts and a dashboard that shows per-worker hashrate shorten the gap between a failure and a fix.
When should an older miner be retired?
When its efficiency can no longer clear the break-even line at your power price. At $0.06/kWh and current output of about $0.038 per TH/s per day, that line sits near 26.4 J/TH; cheaper power moves it up, and any difficulty increase moves it down.
Should I buy more hardware after a difficulty drop?
A drop raises output per TH/s, but it is a small effect next to the cost of idle time and the uncertainty of the next retarget. Size the order from a target balance per month, then verify the arithmetic at the difficulty in force on delivery day.
Time the order with arithmetic
Write down three numbers before committing capital: output per TH/s at the current difficulty, your power price, and the efficiency of the machine you intend to run. Convert the first into a break-even efficiency, compare it with the third, and compute the daily net margin. Then decide whether waiting actually improves that margin — most of the time it does not, because idle hardware earns nothing and difficulty rarely moves as much as a month of output is worth.
Data and sources: ViaBTC mining statistics for per-coin pool hashrate, network hashrate and difficulty[1], the ViaBTC miner profitability ranking for hardware viability at current conditions[2], and the ViaBTC pricing page for settlement rules[3]. Network difficulty (132.76 T), network hashrate (about 1,003 EH/s), the 3.125 BTC block subsidy, the estimated -2.12% next adjustment and the BTC price of $84,692 were read from public chain data and market feeds on 21 September 2026. Figures are illustrative and change with difficulty and price.